Home
Linear Equations and Inequalitie
Solving Inequalities
Absolute Value Inequalities
Graphing Equivalent Fractions Lesson Plan
Investigating Liner Equations Using Graphing Calculator
Graphically solving a System of two Linear Equatio
Shifting Reflecting Sketching Graph
Graphs of Rational Functions
Systems of Equations and Inequalities
Graphing Systems of Linear Equat
LINEAR FUNCTIONS: SLOPE, GRAPHS AND MODELS
Solving Inequalities with Absolute Values
Solving Inequalities
Solving Equations & Inequalities
Graph the rational function
Inequalities and Applications
Inequalities
Using MATLAB to Solve Linear Inequalities
Equations and Inequalities
Graph Linear Inequalities in Two Variables
Solving Equations & Inequalities
Teaching Inequalities:A Hypothetical Classroom Case
Graphing Linear Inequalities and Systems of Inequalities
Inequalities and Applications
Solving Inequalities
Quadratic Inequalities
Inequalities
Solving Systems of Linear Equations by Graphing
Systems of Equations and Inequalities
Graphing Linear Inequalities
Inequalities
Solving Inequalities
Solving Equations Algebraically and Graphically
Graphing Linear Equations
Solving Linear Equations and Inequalities Practice Problems
Graphing Linear Inequalities
Equations and Inequalities
Solving Inequalities

Try the Free Math Solver or Scroll down to Tutorials!


Please use this form if you would like
to have this math solver on your website,
free of charge.


Graphing Linear Equations

By the end of this section, you should be able to solve the following problems:
1. Find the missing values in each coordinate pair and graph the equation

{(?, 2), (4, ?), (?, 0)}
2x + 3y = 2

2. Find the intercepts of the given equation.

−4x + 3y = 12

3. Graph the linear equation. Use intercepts where convenient.

2x − 3y = 1

4. Graph the linear equation. Use intercepts where convenient.
−x + 2y = 4

2 Concepts

When we graph a linear equation we always get a line. That means that it
certainly should not be curved in any way, nor should it have any “elbow”
joints in it. In our first example, we find three points and graph the line.

2.1 Example

Graph:

4x − 2y = 8.

for the values:

{(1, ?), (?, 2), (2, ?)}

In this example, we are given 2 values for x and one value for y, and our
job is to find the missing values.

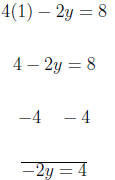
We substitute into the equation to find the missing value. We begin with
x = 1.

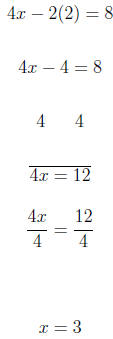
For y = 2 we have

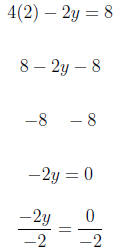
For x = 2 we have

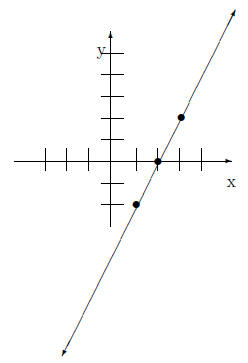
So the set of points we have to graph are: {(1,−2), (3, 2), (2, 0)}
Below we have plotted the points and drawn the graph:

3 Concepts

In our next example, we use what are called the x-intercept and y-intercept to
graph the equation. To find the x-intercept for any equation, simply replace
the y variable with zero. Similarity, to find the y-intercept, simply replace
the x-variable with zero. An example will illustrate.

3.1 Example

Use intercepts to graph the following equation.

2x − 3y = −6

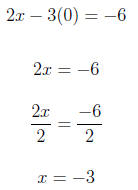
To get one x-intercept we replace y with 0.

So the x-intercept is (-3,0). To find the y-intercept we replace x with 0
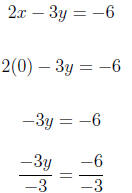
in the equation.

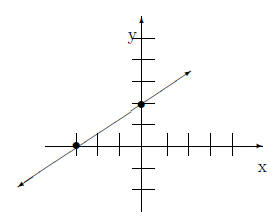
So the y-intercept is (0,2). The graph is below

4 Facts

1. The equation of the y-axis is x = 0.
2. The equation of the x-axis is y = 0.
3. To find the x-intercept replace y with 0 in the equation and solve for x.
4. To find the y-intercept, replace x with zero in the equation and solve
for y.

5 Exercises

1. Find the missing value in each coordinate pair and graph the equation.

{( , 2), (4, ), ( , 0)}
2x + 3y = 2

2. Find the intercepts for the given equation.

−4x + 3y = 12

3. Graph the linear equation. Use intercepts where convenient.

2x − 3y = 1

4. Graph the linear equation. Use intercepts where convenient.

−x + 2y = 4

6 Solutions

1. Find the missing value in each coordinate pair and graph the equation.

{( , 2), (4, ), ( , 0)}
2x + 3y = 2

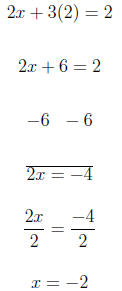
For y = 2 we have

For x = 4

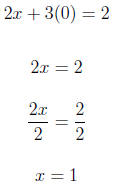
For y = 0

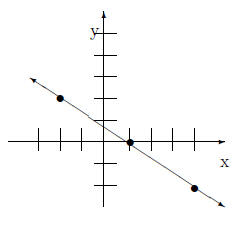
Therefore, we have:

{(−2, 2), (4,−2), (1, 0)}

2. Find the intercepts for the given equation.

−4x + 3y = 12

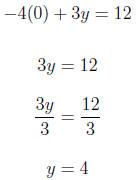
For x = 0

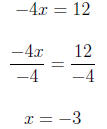
For y = 0

The intercepts are:

{(0, 4), (−3, 0)}

3. Graph the linear equation. Use intercepts where convenient.

2x − 3y = 1

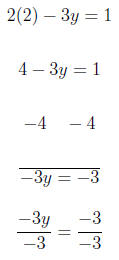
We substitute in x = 2 so we get a number evenly divisible by 3 on the
other side of the equation.

For x = 2

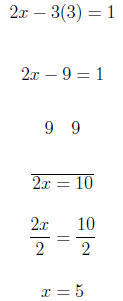
We substitute in y = 3 so we get a number evenly divisible by 2 on the
other side of the equation. For y = 3

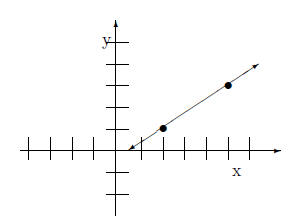
Using (2,1) and (5,3) we graph the equation.

4. Graph the linear equation. Use intercepts where convenient.

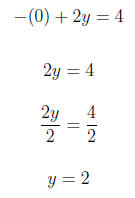
−x + 2y = 4

For x = 0

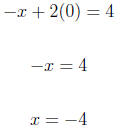
For y = 0

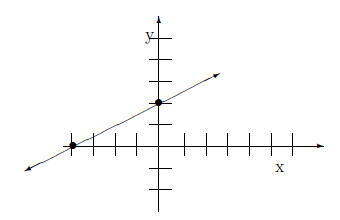
Using (0,2) and (-4,0) we graph the equation