LINEAR FUNCTIONS: SLOPE, GRAPHS AND MODELS
•Find the y-intercept of a line from the
equation y = mx + b or f(x) = mx + b.
•Given two points on a line, find the
slope; given a linear equation, derive
the equivalent slope-intercept equation
and determine the slope and the y-intercept.
•Solve applied problems involving slope.
Linear Function
A linear function f is any function that can be
described by f(x) = mx + b.
Objective
Find the y-intercept of a line from the
equation y = mx + b or f(x) = mx + b.
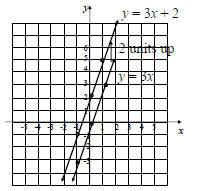
Example A
Graph f (x) = 3x and g(x) = 3x + 2
using the same set of axes.
Solution
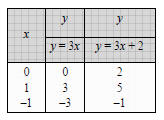
Notice that the graph of
y = 3x + 2 is the graph of
y = 3x shifted, or translated,
2 units up.
y-Intercept of f(x) = mx + b
The y-intercept of the graph of
f(x) = mx + b is the point (0, b)
or, simply, b.
Example B
For each equation, find the y-intercept.
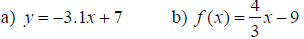
Solution
a) y = −3.1x + 7 (0, 7) is the y-intercept.
 (0, –9) is the y-intercept.
Objective
Given two points on a line, find the
slope; given a linear equation, derive
the equivalent slope-intercept equation
and determine the slope and the
y-intercept.
Slope
The slope of the line containing points
(x1, y1) and (x2, y2) is given by
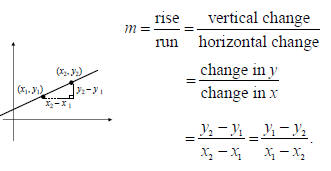
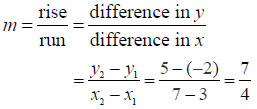
Example C
Graph the line containing the points (3, –2)
and (7, 5) and find the slope.
Solution
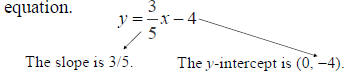
Example D
Determine the slope and y-intercept of the
line given by

Solution
The equation is written in the form y = mx + b,
simply read the slope and y-intercept from the
Example E
Determine the slope and y-intercept of the
line given by 4x − 7 y = 2.
Solution
First solve for y so we can easily read the
slope and y-intercept.
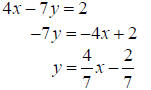
The slope is 4/7 and the y-intercept is (0, –2/7).
Objective
Solve applied problems involving
slope.
Some applications use slope to measure the steepness.
For example, numbers like 2%, 3%, and 6% are often
used to represent the grade of a road, a measure of a
road’s steepness. That is, a 3% grade means that for
every horizontal distance of 100 ft, the road rises or
drops 3 ft.
Slope can also be considered as a rate of change.
Example F
Find the slope (or grade) of the treadmill.
Solution
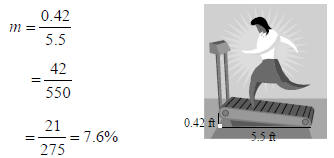
The grade of the treadmill is 7.6%.
** Reminder: Grade is slope expressed as a percent.
Example G Wanda’s Hair Salon has a graph
displaying data from a recent day of work.
a) What rate can be
determined from the
graph?
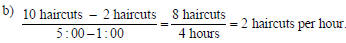
b) What is that rate?
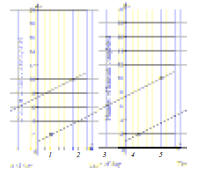
Solution
a) We can find the rate
Number of haircuts per
hour.
|